
Shiba Inu Formed This Pattern, Breakout Incoming?

The Shiba Inu price has moved south on its chart over the last 24 hours. In the same time frame, SHIB depreciated by 3%. In the past week, the meme coin also did not register gains, losing a few support lines after losing close to 6% of its market value.

SHIB has now formed a pattern that indicates that the coin might witness a breakout to the upside in the coming 24 hours. The technical outlook still displays bearish signs on the daily chart. Sellers have remained in control of the price for most of this month.

Buyers still have to come to the rescue for SHIB to follow through with an upside breakout. According to the technicals, the coin might fall on its chart over the immediate trading sessions and then move to the upside.

The trading volume of SHIB declined, which supports the notion that buyers have remained low in the market. At the moment, SHIB is trading 90% below its all-time high, which the coin secured almost one year ago.

Shiba Inu Price Analysis: One-Day Chart
Shiba Inu

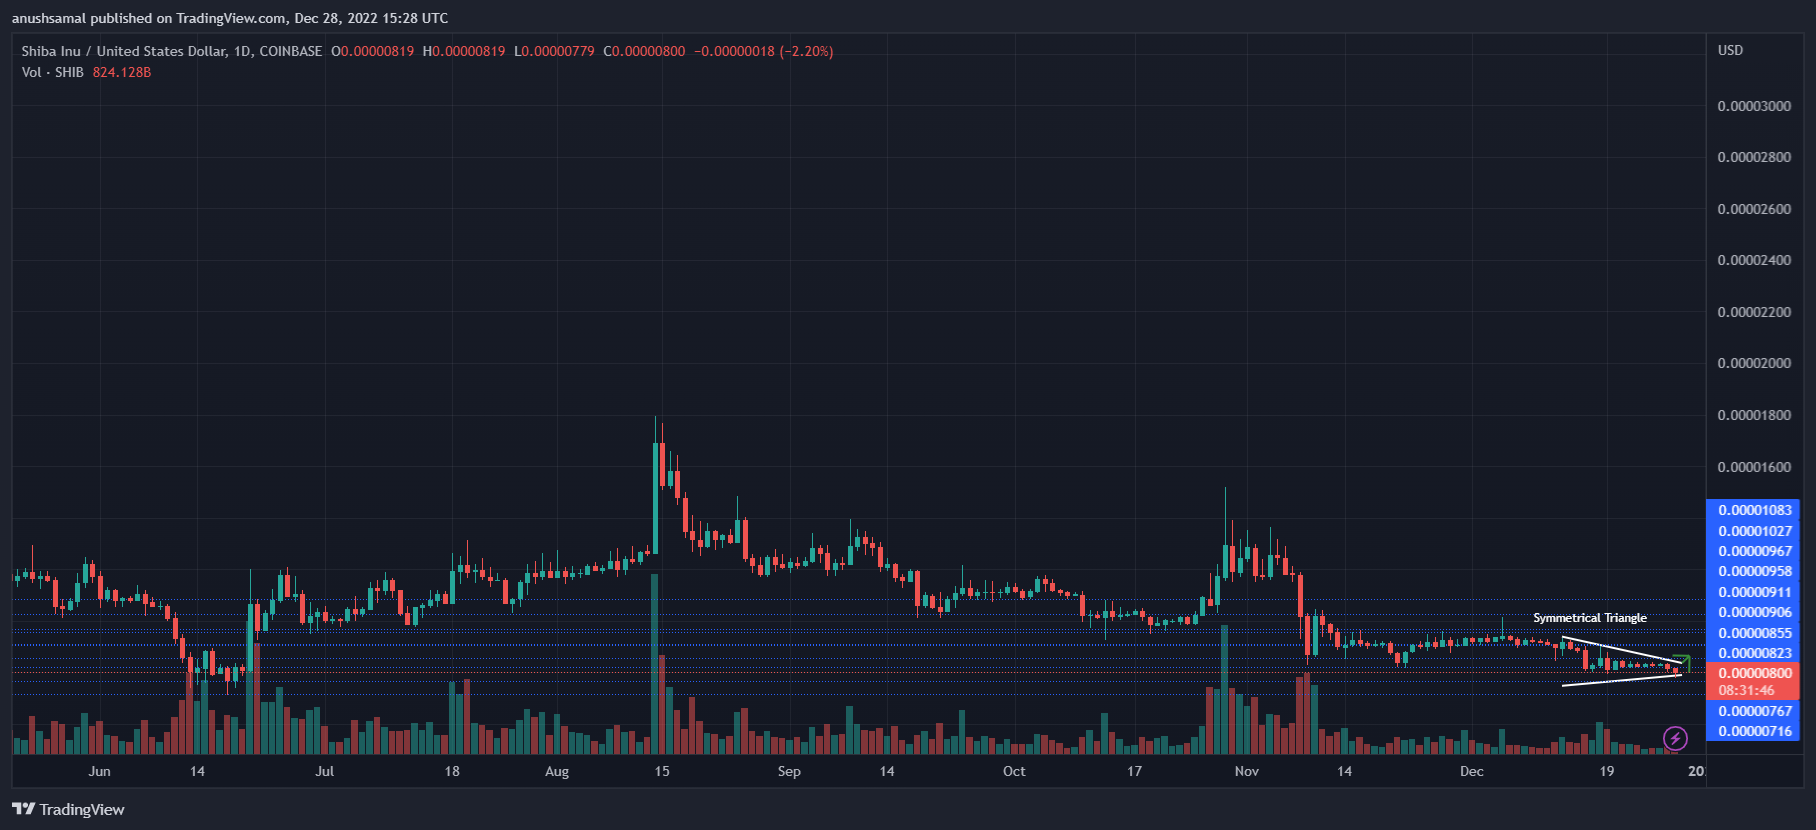
SHIB was exchanging hands at $0.0000080 at the time of writing. Over the past week, the Shiba Inu price fell from the $0.0000082 support line. Shiba Inu is expected to fall below the $0.0000080 level as buying strength remains low.

It has formed a symmetrical triangle pattern which re-affirms that the coin could witness a rally due to a breakout. The first local support stood at $0.0000076, after which the meme coin is expected to break out.

The breakout will cause the Shiba Inu price to rally to $0.00000824, and clearing that resistance will take the coin to $0.0000086. The amount of Shiba Inu traded in the last session declined, which explains why buyers remained low.

Technical Analysis
Shiba Inu

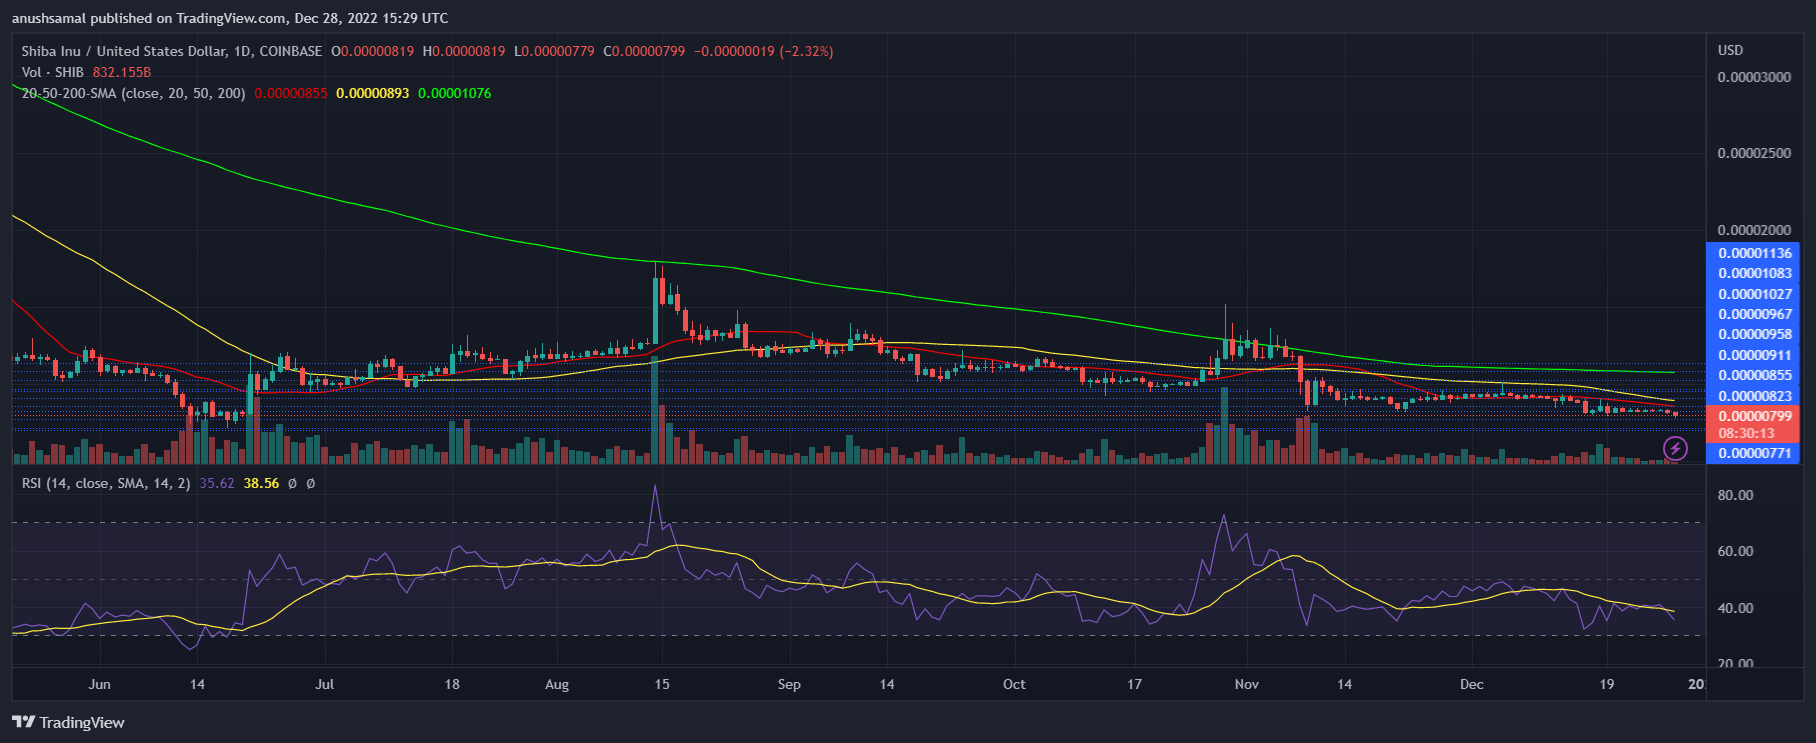
SHIB was in the sellers’ dominance zone for November and December. The Relative Strength Index was below the 40 mark after the recent fall in price. The indicator’s reading displayed that sellers exceeded buyers at press time, indicating bearishness.

On the same note, due to a lack of demand, SHIB traveled below the 20-Simple Moving Average line (SMA), which meant that sellers were driving the price momentum in the market. If SHIB remains above the $0.0000080 mark, the meme coin will move above the 20-SMA.
Shiba Inu

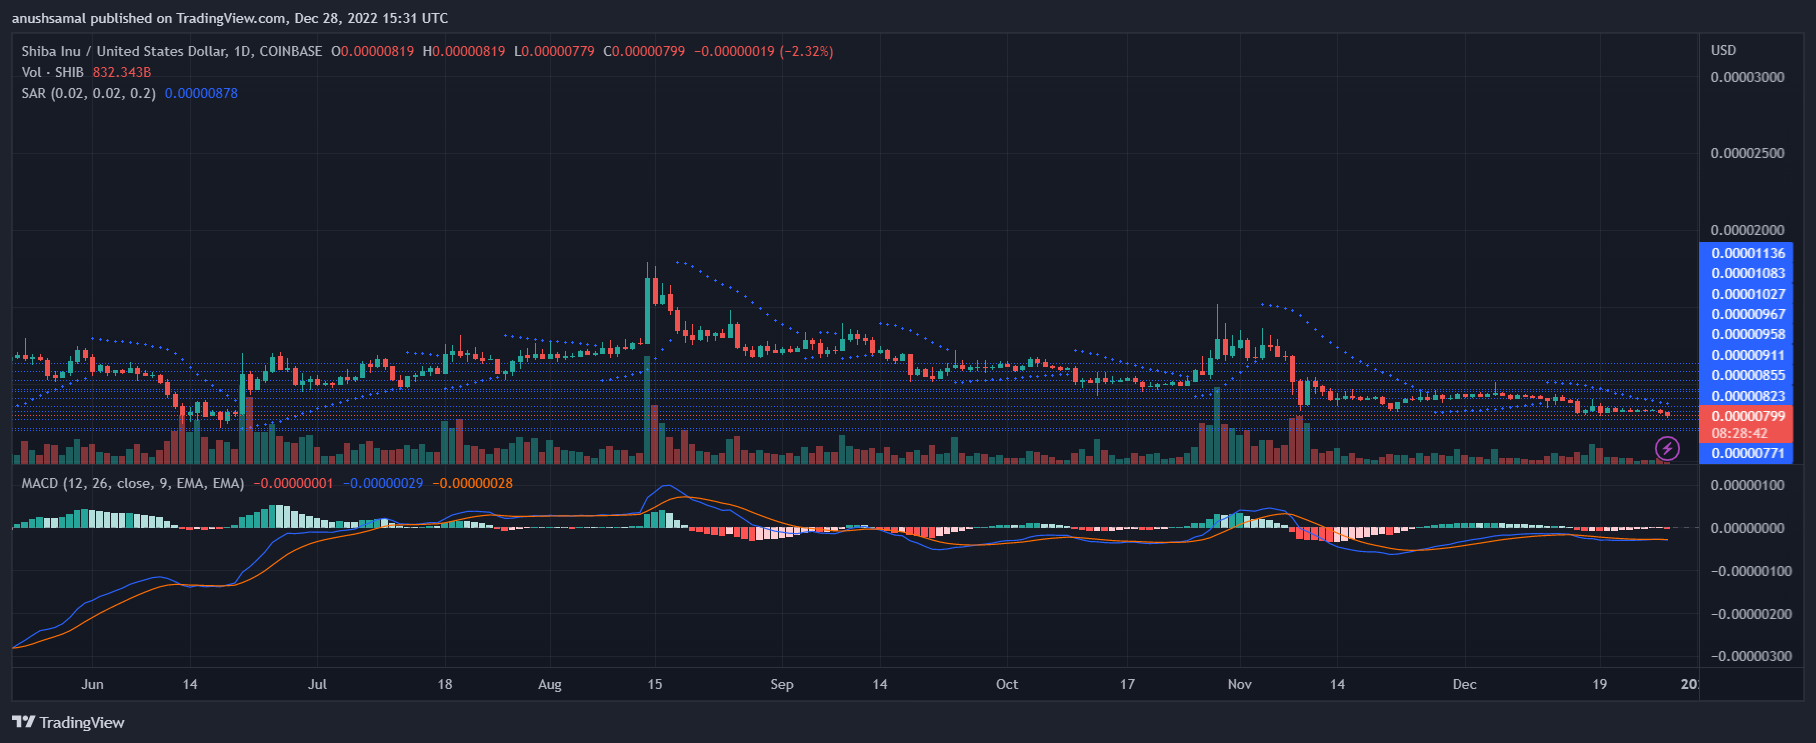
Other technical indicators have also sided with the possibility of SHIB’s value dropping on its chart. The Parabolic SAR demonstrates the price direction and the trend of the asset. The indicator was above the price candlesticks, which indicates that the price is in a continued downtrend.

The Moving Average Convergence Divergence (MACD) presents price momentum and trend reversals. MACD continued to paint red histograms, which meant that this was an indication for traders to sell, as that would mean that the price of SHIB could increase.


from NewsBTC https://ift.tt/t7aFfUp
via IFTTT

Comments

Popular posts from this blog

TA: Ethereum Remains Strong, Why ETH Could Rally Above $2.3K

Ethereum is trading in a positive zone above the $2,150 support zone the 100 hourly SMA against the US Dollar. ETH price is likely to rally if there is a clear break above $2,300. Ethereum is trading in a positive zone above the $2,100 and $2,150 support levels. The price is now trading above $2,100 and the 100 hourly simple moving average. There is a key bullish trend line forming with support near $2,140 on the hourly chart of ETH/USD (data feed via Kraken). The pair start a fresh rally above $2,300 as long as it is above the $2,000 support zone. Ethereum Price Is Showing Positive Signs After forming a base above $2,000, ethereum started a steady increase . ETH broke the $2,200 resistance zone and it settled nicely above the 100 hourly simple moving average. The price even spiked above the $2,250 resistance level. However, the price seems to be struggling to gain pace above $2,250, similar to bitcoin . A high is formed near $2,285 and ether is now correcting lower. There was...

I Stand By My $100,000 Bitcoin Price Target, Anthony Scaramucci

Anthony Scaramucci has again reiterated his stand on why he thinks bitcoin will still hit the $100,000 price target he had earlier set. Scaramucci had put forth this forecast when he was on Yahoo! Finance earlier in the year. The founder explained that bitcoin could easily be trading at $100,000 in 12 months. Anthony Scaramucci who founded Skybridge Capital in 2005 has not always been bullish on bitcoin. But has slowly come around over the years and has now gotten into bitcoin. The CEO believes that more and more funds will get into bitcoin as time passes. His message to other money managers had been that he believed the performance of their funds will eventually be benched off of bitcoin. Related Reading |  Bitcoin Whale Warns Of “November 2018 Vibes.” What This Means Scaramucci took this one step further when he founded the Skybridge Bitcoin Fund early this year. An institutional-grade fund that was created specifically to invest in bitcoin, which it considers to be the larg...

SubQuery raises $9M for Polkadot data protocol

Blockchain venture capitalists continue to fund Polkadot projects with growing conviction. SubQuery aims to bring data indexing infrastructure to the network. Decentralized data aggregator SubQuery has concluded a $9 million funding round to build Polkadot’s first data aggregation layer, a move that could strengthen data indexing for the emerging interoperability network. The investment funds will be used to continue building SubQuery’s data indexing infrastructure for all Polkadot and Kusama applications, the company announced Wednesday. SubQuery also announced the investment would help it expand its technical abilities and support the open-sourcing of its software. This investment round was co-led by Arrington XRP Capital, Digital Currency Group and Stratos Technologies with additional participation from Hypersphere Ventures, NGC Ventures, Wintermute and Skynet Trading. Previously, SubQuery successfully raised $1.8 million in a private seed round that concluded in March of this y...