
TA: Ethereum Gains Bullish Momentum, Why ETH Could Retest $620

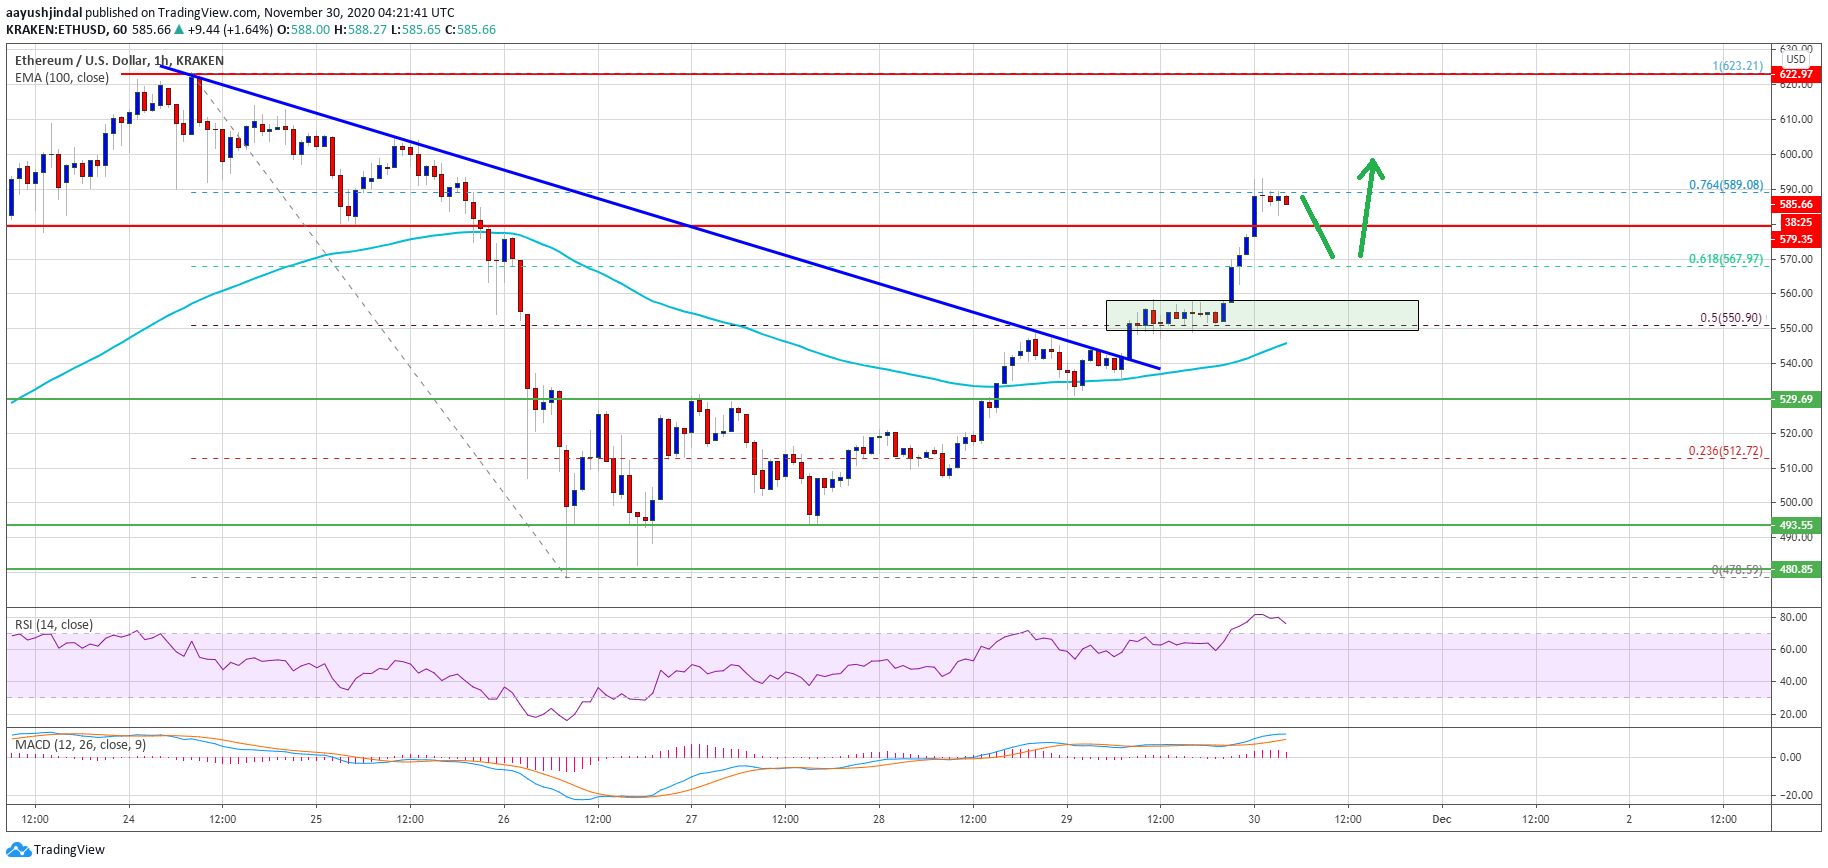
Ethereum gained bullish momentum and broke the $550 resistance against the US Dollar. ETH price is up over 8% and it seems like the bulls are aiming $600 or $620.

  • Ethereum started a fresh increase after it broke the $530 resistance level.
  • The price surpassed a major hurdle at $550 and the 100 hourly simple moving average.
  • There was a break above a key bearish trend line with resistance near $540 on the hourly chart of ETH/USD (data feed via Kraken).
  • The pair is trading in a positive zone and it could higher towards $600 or $620.

Ethereum Price is Up 8%

In the weekly analysis, we discussed the importance of the $550 resistance for Ethereum. ETH price started following a steady bullish path, and surpassed many hurdles near the $540 and $550 levels.

Bitcoin price also gained traction above $18,200, helping ether to clear the $550 resistance. There was also a break above a key bearish trend line with resistance near $540 on the hourly chart of ETH/USD. There was also a break above the 50% Fib retracement level of the key decline from the $623 swing high to $478 low.
Ethereum Price

Source: ETHUSD on TradingView.com

The pair settled nicely above the $565 level and the 100 hourly simple moving average. Ether tested the $590 resistance level. It seems like the bears are protecting the 76.4% Fib retracement level of the key decline from the $623 swing high to $478 low.

A clear break above the $590 level could open the doors for more gains above $600. In the stated case, the price is likely to revisit the $620 resistance or the $623 swing high in the near term. Any further gains may possibly push the price towards the $650 level.

Dips Supported in ETH?

If ethereum fails to clear the $590 resistance level, there could be a minor downside correction. An initial support is near the $580 level (a multi-touch zone).

A downside break below the $580 level might call for an extended decline. The next major support is near the $560 and $550 levels, followed by the key 100 hourly simple moving average. Any further losses could lead ether towards the $530 support level.

Technical Indicators

Hourly MACD – The MACD for ETH/USD is slowly losing momentum in the bullish zone.

Hourly RSI – The RSI for ETH/USD is currently well above the 50 level.

Major Support Level – $550

Major Resistance Level – $590


from NewsBTC https://ift.tt/3lh2xDL
via IFTTT

Comments

Popular posts from this blog

Whale clusters suggest that this key Bitcoin level can trigger an explosive rally

Bitcoin whale clusters show $57,046 and $60,045 are the crucial support and resistance levels in the short term. The price of Bitcoin ( BTC ) is attempting to break the $60,000 resistance level after more than a week of ranging. Whale clusters show that $57,046 and $60,045 are the crucial support and resistance areas in the short term.  In other words, the probability of a strong breakout in the foreseeable future would increase substantially if Bitcoin stays above $57,046 and continues to test $60,000 resistance. Why whale clusters are important for Bitcoin Whale clusters form when high-net-worth investors buy or sell Bitcoin at a certain price and do not move their holdings thereafter. As such, a whale cluster support typically serves as a strong macro support area for Bitcoin because whales tend to buy more when BTC falls to a level where they initially bought BTC. On the flip side, a whale cluster resistance area would likely hold up as a sell area because whales are mo...

TA: Ethereum Remains Strong, Why ETH Could Rally Above $2.3K

Ethereum is trading in a positive zone above the $2,150 support zone the 100 hourly SMA against the US Dollar. ETH price is likely to rally if there is a clear break above $2,300. Ethereum is trading in a positive zone above the $2,100 and $2,150 support levels. The price is now trading above $2,100 and the 100 hourly simple moving average. There is a key bullish trend line forming with support near $2,140 on the hourly chart of ETH/USD (data feed via Kraken). The pair start a fresh rally above $2,300 as long as it is above the $2,000 support zone. Ethereum Price Is Showing Positive Signs After forming a base above $2,000, ethereum started a steady increase . ETH broke the $2,200 resistance zone and it settled nicely above the 100 hourly simple moving average. The price even spiked above the $2,250 resistance level. However, the price seems to be struggling to gain pace above $2,250, similar to bitcoin . A high is formed near $2,285 and ether is now correcting lower. There was...

I Stand By My $100,000 Bitcoin Price Target, Anthony Scaramucci

Anthony Scaramucci has again reiterated his stand on why he thinks bitcoin will still hit the $100,000 price target he had earlier set. Scaramucci had put forth this forecast when he was on Yahoo! Finance earlier in the year. The founder explained that bitcoin could easily be trading at $100,000 in 12 months. Anthony Scaramucci who founded Skybridge Capital in 2005 has not always been bullish on bitcoin. But has slowly come around over the years and has now gotten into bitcoin. The CEO believes that more and more funds will get into bitcoin as time passes. His message to other money managers had been that he believed the performance of their funds will eventually be benched off of bitcoin. Related Reading |  Bitcoin Whale Warns Of “November 2018 Vibes.” What This Means Scaramucci took this one step further when he founded the Skybridge Bitcoin Fund early this year. An institutional-grade fund that was created specifically to invest in bitcoin, which it considers to be the larg...